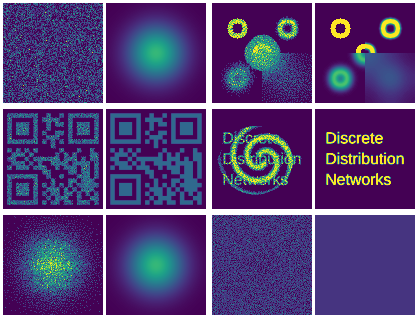
2D Density Estimation with 10,000 Nodes DDN
This GIF demonstrates the optimization process of 2D probability density estimationn using a Discrete Distribution Network with 10,000 nodes.

- Left image: All samples that can currently be generated
- Right image: Target probability density map
- For demonstration purposes, the target probability density maps switch periodically. Names and sequence
of target probability maps:
gaussian->blur_circles->QR_code->spiral->words->gaussian->uniform->gaussian(same at beginning and end, completing a cycle)
- Therefore DDN continuously optimizes parameters to fit new distributions
- Optimizer: Gradient Descent with Split-and-Prune
- The experiment code is in sddn/toy_exp.py, and the experimental environment is provided by the distribution_playground library, feel free to play with it yourself
- Tips: You can use a phone camera to scan out the QR code distribution fitted by DDN at a suitable screen distance